
“How to Get Hired with Your Data Analytics Portfolio?”🎯


Landing your dream data analyst job in today’s competitive market requires more than just a stellar resume; it demands a compelling data analytics portfolio. This isn’t just a collection of your work; it’s your personal showcase, demonstrating your skills, fundamental knowledge, problem-solving abilities, and insightful storytelling to potential employers.
For aspiring data analysts, job seekers, and career switchers, your standout data analytics projects can be the key to landing your dream job as a data analyst, often weighing more heavily than your certifications or academic background. It serves as tangible proof of your abilities.
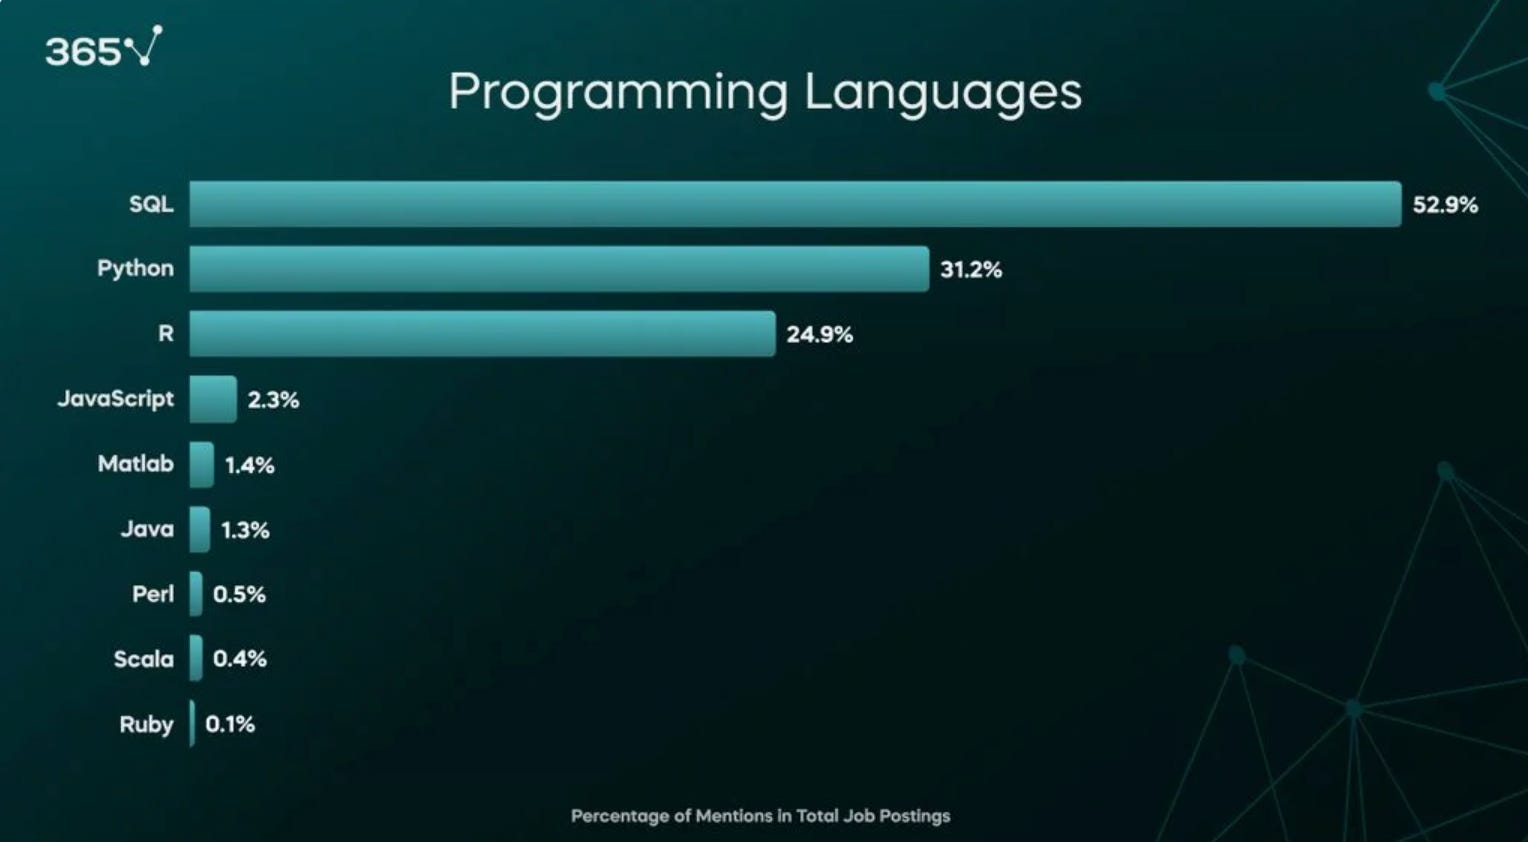
Thus, building a strong portfolio is about demonstrating your readiness for real-world challenges. According to research on 1,000 job postings (sourced from Indeed), many hiring employers place more value on analytical skills rather than experience.
In this comprehensive guide, we’ll dive into common pitfalls found in data analytics portfolio projects. It will help equip you with actionable tips as well as significantly boost your chances of landing that coveted data analyst role.
1. Defined Business Goals
One of the most frequent portfolio mistakes is approaching projects as purely technical exercises, focusing solely on implementing complex algorithms without defining the underlying business problems they are trying to solve. Recruiters are looking for candidates who can translate data into actionable business value by leveraging their technical skills.
🔹Why it’s a pitfall:
Without a clear business objective, your project can appear aimless and theoretical. It fails to demonstrate your ability to connect data analysis to real-world decision-making, a crucial skill for any data analyst role. Consequently, it fails to demonstrate how you’d contribute to a company.
🔹How to fix it:
First and foremost, you need to define what business objectives are, identify who the audience is, and determine how you can make decisions based on insights.
🔹Actionable Tip:
Clearly state the business problem at the outset and outline the potential impact of your findings. Frame your analysis around addressing specific business questions using the SMART framework-Specific, Measurable, Achievable, Relevant, and Time-bound.
For example:
👎Instead of: “Analyze the California housing dataset.”
👍Do this: “Analyze the California housing dataset to identify key features influencing median house values, helping potential real estate investors make informed purchasing decisions in different regions.”
👉 Document this in your project's GitHub README or Kaggle notebook. This approach not only clarifies your intent but also makes your data analytics portfolio more appealing in job applications, showing that you think like a business-savvy analyst.
2. Prioritize Strong Fundamental Knowledge
Many job seekers overload their data analytics projects with complex machine learning algorithms they’ve learned, or use cutting-edge tools to impress employers, when a simple approach would suffice. This often signals either gaps in core skills or a weak grasp of fundamental concepts. Recruiters prioritize strong foundational knowledge, such as SQL queries, Excel pivots, basic Python and R scripting, and clear visualizations for entry-level data analyst roles. It is important for candidates to demonstrate the ability to choose the right tool for the job.
🔹Why it’s a pitfall:
Relying too heavily on advanced tools without first mastering the basics can result in unclear analysis and demonstrate poor judgment, similar to attempting to construct a skyscraper without first learning how to lay bricks.
🔹How to Fix it:
Focus on demonstrating proficiency in the core data analysis process: data cleaning, exploratory data analysis (EDA), data visualization, and basic statistical modelling. Only introduce more advanced techniques if they genuinely add value and are appropriate for the problem at hand.
🔹Actionable Tip:
For every project, justify your tool and method choices. If you use a complex machine learning model, briefly explain why it was deemed necessary over a simple regression. Ensure your portfolio projects clearly demonstrate:
SQL proficiency for data extraction and manipulation.
Python and R basics for data processing and analysis.
Excellent data visualization skills to communicate insights effectively.
Statistical understanding to interpret results correctly.
For example:
👎Instead of: “Jump straight to a neural network for a simple prediction task”,
👍Do this: “Show how you first explored linear regression, explain its limitations, and then justify moving to a more complex model if necessary.”
👉 This progressive approach highlights your thoughtful, iterative decision-making and demonstrates your fundamental knowledge of data analysis.
3. Tell a Compelling Story with Your Data
Many data analytics portfolio projects fall short by presenting only raw code or isolated charts, failing to tell a compelling story with data or connect the analysis to a meaningful business context. Your project should guide non-technical stakeholders through your thought process, from problem identification to actionable insights.
🔹Why it’s a pitfall:
Recruiters and hiring managers often only spend a few minutes reviewing a portfolio, so it is crucial to communicate clearly. Your objectives, approach, and findings should be immediately understood. Otherwise, they will move on.
🔹How to fix it:
Structure your project like a report or a story, not just a code dump. Each analysis process should contribute to the narrative:
Introduction: Clearly state the business problem and your project’s objective.
Data acquisition & Cleaning: Briefly describe the data sources and the data cleaning steps you took.
Exploratory data analysis (EDA): Present key findings and visualizations that reveal insights about the data and inform your next steps. Explain what you found and why it matters.
Methodology: Explain your analytical approach, models used, and why they were chosen.
Results & Interpretation: Present your findings clearly, using compelling visualizations. Explain what your results mean in a business context.
Recommendations & Conclusion: Offer actionable, data-driven recommendations that address the initial business problem. Discuss limitations and future work.
🔹Actionable Tip:
Use markdown cells in Jupyter Notebooks or detailed READMEs on GitHub to provide a narrative. Ensure all visualizations have clear titles, labels, and brief explanations. Imagine you’re presenting this to a non-technical stakeholder.
For example:
👎Instead of: In a healthcare data project, don’t just show correlations between patient age and readmission rates.
👍Do this: Tell the story: “Faced with rising hospital costs, I analyzed 10,000 patient records to identify at-risk groups, revealing that patients over 65 had a 20% higher readmission rate due to medication non-adherence. My recommendation? Implement targeted follow-up programs, potentially saving $500,000 annually.”
👉 By doing this, your data analytics projects will become compelling stories that enhance your prospects in the job market.
4. Tackle with Dirty & Diverse Data
If you rely on pre-cleaned, perfectly structured public datasets, your credibility can be undermined, as it fails to demonstrate your ability to manage the messy, imperfect data common in real-world scenarios. Recruiters want evidence that you can handle incomplete, inconsistent, and biased data - the very challenges where data analysts spend a considerable amount of their time.
🔹Why it’s a pitfall:
It suggests inexperience with data wrangling-which makes up 60-80% of a data analyst’s work-and a lack of initiative in sourcing or combining datasets.
🔹How to fix it:
Seek out more challenging datasets or create your own by combining multiple sources.
🔹Actionable Tip:
Web Scraping: Scrap data from websites relevant to a business problem.
APIs: Utilize public APIs to collect fresh, dynamic data.
Combine datasets: Take two or three related datasets from different sources and merge them for a more complex analysis.
Simulate Messiness: Deliberately introduce missing values or inconsistencies into a clean dataset and then demonstrate your methods for handling them.
Document Data Cleaning: Explicitly describe the steps you took to clean, preprocess, and transform your data. It makes an impressive application.
For example:
👎Instead of: a pre-clean sales dataset
👍Do this: Tackle raw sales data with missing entries, inconsistent formats, and perhaps even combine it with customer feedback data, which might be unstructured text, to perform a more comprehensive analysis.
👉 The authenticity in your data analytics portfolio shows that you’re ready for the complexities of the role, helping you stand out and learn how to land a data analyst job.
5. Ensure Reproducibility and Documentation
Imagine a recruiter reviewing your data analytics projects and finding a cryptic folder of files with no explanation, or code that throws errors when they try to run it. A professional data analyst needs to ensure that their work is understandable, verifiable, and usable by others.
🔹Why it’s a pitfall:
It shows a lack of attention to detail, poor collaboration skills, and makes it difficult for recruiters to evaluate your actual process and thoughts. A project that can’t be easily understood or executed may become useless.
🔹How to fix it:
Every project in your data analytics portfolio should be well-documented and hosted on platforms like GitHub or Kaggle.
🔹Actionable Tip:
GitHub Repository: Host all your project files: code, data, reports in a public GitHub repository. This demonstrates version control skills.
Comprehensive README: Every GitHub repository should have a detailed README.md file. This is your project’s cover letter. It should include: 1. Project title and brief description, 2. Clearly stated business problem and goals, 3. Data sources used, 4. Technologies and libraries required, 5. Instructions on how to run the project, 6. Key findings and insights, and 7. Links to deployed applications or interactive dashboards if applicable.
Clean Notebooks: If using Jupyter notebooks, ensure they are clean, executable from top to bottom, and include markdown cells for explanations. Remove unnecessary code or lengthy outputs.
Consistent Naming Conventions: Use clear and consistent file and variable naming.
Conclusion: Audit your Portfolio, Land Your Dream Job💡
Your data analytics portfolio is one of the most powerful tools in your job application journey. Instead of simply collecting projects, curate them carefully by revisiting your work with a critical eye. Highlight clear objectives, compelling narratives, and your ability to handle real-world data challenges.
This approach not only strengthens your portfolio but also sharpens your skills as a data analyst. A well-crafted data analytics portfolio isn’t just about how to get a data analyst job; it’s about confidently demonstrating to recruiters that you can solve business problems.
Start auditing your projects today, apply these tips, and make your data speak with confidence. What portfolio mistakes have you made? Share in the comment below! 👇
🔗Connect with me: